Boiling the poor frogs
October 02, 20203 minsIn the recently concluded first American Presidential debate, the stark economic policy difference between the two candidates was best illustated by their responses to “how exactly is the American economy recovering”. Trump answer was “V-shaped” while Biden said “K-shaped”.
Trump’s assessment is supported by the fact that V-shaped recovery is supported by the fact that the when the pandemic hit, 22 million jobs vanished, and already 10.6 have been added back. However, small businesses were absolutely slammed by the pandemic and many may never reopen. Many Americans were able to get by because of direct payments and unemployment benefits under the unprecedented $2.2 trillion CARES Act passed in March. Those benefits expired at the end of July and this is what Jerome Powell, Federal Reserve Chairman has to say about it: “The risk going forward is that people are spending [now] because they have money in the bank even though they’re unemployed. It’s likely that additional fiscal support will be needed.”
In a K-shaped recovery, the economic bounce-back is bifurcated like a “K”: The wealthiest Americans are quickly rebounding, even thriving, while the middle- and lower-income set are not. US stocks have soared to record highs following the March selloff, thanks in large part to the Federal Reserve pumping cash into the market. Biden’s assessment is supported by the fact that most Americans aren’t feeling that boost - as of Q1 2020, the wealthiest 10% of American households owned 87% of all stocks and mutual funds. Just over half of American families have some level of investment in the market, mostly through 401(k)s and other retirement accounts. Only 14% of households are directly invested in the market. In other words, Wall Street’s fortunes don’t reflect the realities on Main Street. The US economy is still down 11.5 million jobs during the pandemic, which means the economy has a long way to go. Many Americans’ jobs are never coming back.
Closer home, TN Ninan writes about the Indian economy’s K-shaped recovery (hint: it won’t be pretty).
The growing part of the “K” can be summed up by this:
Companies servicing distance-working or -learning are having a heyday (more “unicorns” and sudden wealth), as are the makers of pharmaceutical products, while the commercial real estate market and makers of formal office shirts experience a slump. Qantas has taken to selling pyjamas! Within sectors, the big are eating the small: Jio swallows most of the Future Group, forcing the next in line, D-Mart, to adopt price discounting; and Adani acquires local airport monopolies and has a quasi-monopoly on ports (reflected in skewed port charges). As Saurabh Mukherjea of the Marcellus fund house has been arguing, the concentration of profits in the hands of sector leaders has reached unprecedented levels. Market regulators and the Competition Commission seem blind or comatose, compared to places like Europe and Australia, where they are taking on the tech giants and their uncompetitive behaviour.
The forces causing slow growth and rising inequality were there pre-Covid, it’s just those trends have accelerated. He writes cynically (and I’m inclined to agree) about the bottom shrinking part of the “K”:
In a social welfare model, governments would take care of the losers among people while enabling small and medium businesses to keep going (think Germany’s Mittelstand). But increasingly, governments don’t have the capacity or the competence to deal with the scale of what confronts them. This encourages escapism through the politics and economics of nationalism, made worse by tribalism or nativism, the package accompanied inevitably by the erosion of institutional bulwarks and therefore state capture by powerful businessmen.
How unequal is India?
We know that the gap between the rich and poor keeps widening. How bad is it exactly? This chart from the 2018 Credit Suisse report (appropriately titled The Indian Plutocracy) provides the answer.
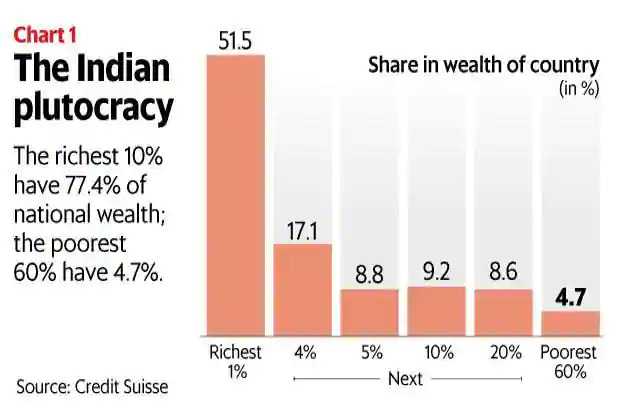 Some stats bear repeating:
- Richest 10% have 77% of the national wealth while the bottom 60% are splitting a pittance of the 4.7% pie
- The Gini coefficient, a leading measure of income ineqaulity has gone up from 81.3% in 2013 to 85.4% in 2018 (100% denotes perfect inequality and zero indicating perfect equality)
- While mean wealth per adult increased at a CAGR of 8.3% between 2013 and 2018, the growth in median wealth per adult was at a much more sober CAGR of 4.4%. So the rich have benefited more.
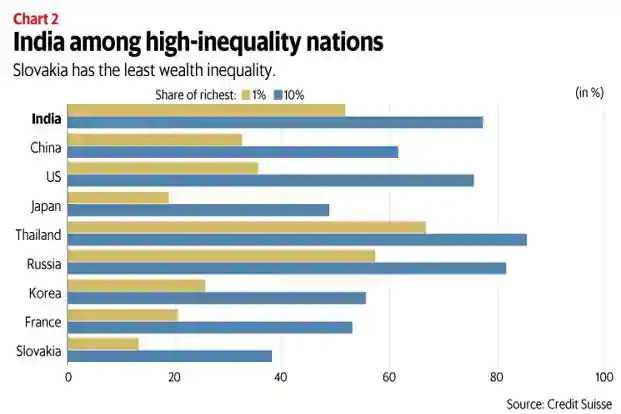
Sadly, India leads the world in the list of most unequal nations with China and US in hot pursuit.
It’s 2020 October and Mukesh Ambani has been adding 90 crores per hour since the beginning of Covid. I have two questions for you readers:
- What do you reckon India’s Gini coefficient is in 2018?
- What % of India’s top 1% does Ambani’s net worth represent?
Closing on an optimistic and exhortive note, I’ll adopt a quote from a different domain - The best time to address inequality was 10 years ago, the second best time is now.